
Alice Chen




| Picture | Part Number | Manufacturer | Stock | Action |
|---|---|---|---|---|
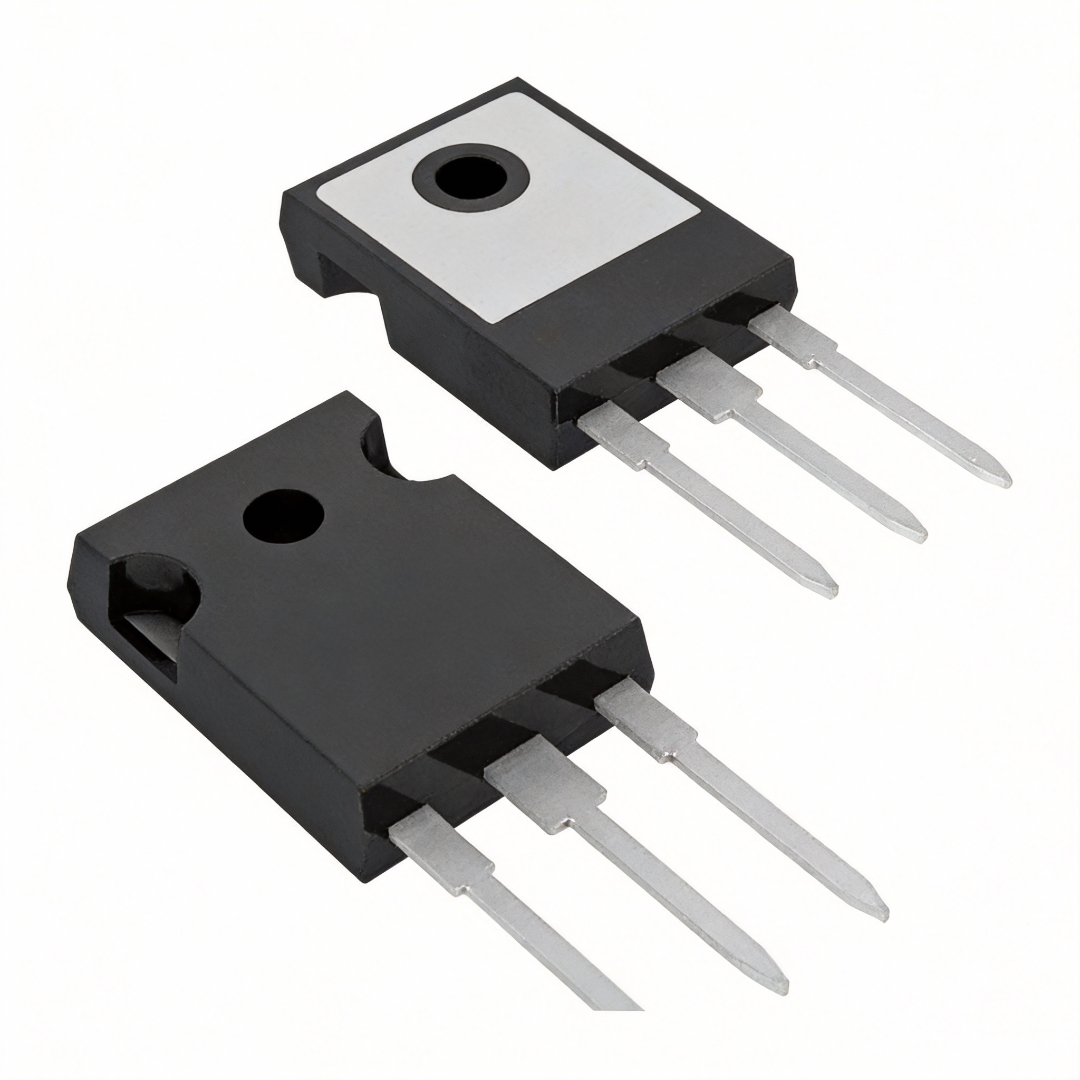 | PMEG2010ER115 | NXP | 3,120 |
Forward voltage covers conduction loss only. Reverse leakage during blocking intervals and the actual heat-removal path also contribute. Leakage changes with temperature, so a room-temperature forward-loss estimate cannot by itself establish a stable operating junction temperature.
Table 7 gives 0.17 mA typical and 0.6 mA maximum at 10 V, and 0.32 mA typical and 1.5 mA maximum at 20 V. These are pulsed tests with duration ≤300 µs and duty ≤0.02; they are not guaranteed continuous hot-leakage values.
Only if the cathode is ground in the actual circuit. The thermal solder-point reference is the cathode tab, but its copper and vias must remain on the cathode electrical net. Otherwise a ground connection can short or alter the circuit.
No. The datasheet’s 1 A forward-current limit requires cathode solder-point temperature no higher than 55°C. Board copper, thermal environment, waveform and reverse loss determine whether an application meets that condition. A nominal current label does not replace thermal validation.
By Alice Chen | YG GROUP
The PMEG2010AEB,115 is a 20 V Schottky rectifier in a small SOD523 package. Forward voltage describes only part of its dissipation. Reverse bias, temperature-dependent leakage and the board’s cathode heat path must also be considered before translating a nominal current rating into an operating temperature.
The PMEG2010AEB,115 can look attractive when a selection spreadsheet compares only forward voltage. Its small SOD523 body also makes placement easy. Neither observation determines its temperature in a circuit that spends much of its time reverse biased. The operating waveform, reverse leakage and heat-removal path have to be evaluated together.
The Nexperia PMEG2010AEB datasheet dated 6 August 2026 provides the device facts used here. It specifies a 20 V reverse-voltage limit and a 1 A forward-current limit conditioned on a solder-point temperature no higher than 55°C. That current limit is not a statement that the diode can carry 1 A continuously on any small PCB at room ambient. The exact board and waveform remain part of the design.
Table 1. Diode limits with test conditions | Source: manufacturer documents in References; assumptions and operating conditions are stated in the table or adjacent text. Compiled / calculated by: YG GROUP.
| Datasheet quantity | Typical | Maximum | Conditions and boundary |
|---|---|---|---|
| Forward voltage | 230 mV | 290 mV | IF = 100 mA, ambient 25°C |
| Forward voltage | 510 mV | 620 mV | IF = 1 A, ambient 25°C |
| Reverse current | 0.17 mA | 0.6 mA | VR = 10 V, 25°C, pulsed test |
| Reverse current | 0.32 mA | 1.5 mA | VR = 20 V, 25°C, pulsed test |
| Junction-to-ambient thermal resistance | — | 400 K/W | Specified SOD523 standard mounting conditions |
| Junction-to-solder-point thermal resistance | — | 75 K/W | Solder point at the cathode tab |
The reverse-current tests use pulse duration no more than 300 µs and duty factor no more than 0.02. Keep that qualifier attached to the values. A short, low-duty test suppresses self-heating; it is not the same condition as long-duration reverse bias on a warm board. The typical reverse-current curves show temperature dependence at −40°C, 25°C and 85°C. They support concern about hot leakage but do not provide a guaranteed 125°C leakage value.
For a first-order waveform budget, average forward loss is the time average of VF(t) IF(t) over the conducting intervals. Average reverse loss is the time average of VR(t) IR(t) over the blocking intervals. Any relevant switching-related loss must be considered separately. A single forward-current sample multiplied by a headline forward voltage cannot represent every part of a switching cycle.
At the 25°C table point, 100 mA times the typical 230 mV forward drop equals 23 mW while conducting. At 10 V reverse bias, the typical pulsed-test leakage implies 1.7 mW, and the maximum implies 6 mW. At 20 V, the corresponding products are 6.4 mW and 30 mW. These are calculated electrical powers at the cited reference points, before applying time fractions or accounting for temperature changes. They are not measured dissipation in a finished product.

Figure 1. Calculated P = V R × I R, using PMEG2010AEB Table 7 points at 25°C. Leakage tests use pulses ≤300 µs and duty ≤0.02. The curves are arithmetic sensitivity lines, not measured hot leakage or a steady-state junction-temperature prediction. Source: manufacturer documents in References; calculation / diagram: YG GROUP.
Consider a circuit with brief conduction and long blocking intervals. Even when its peak forward current looks modest, reverse power can remain present for most of the operating time. That is the reason to inspect the entire waveform rather than assume that the low forward drop makes every operating state thermally insignificant. Conversely, the 20 V limiting rating is not a recommended operating bias with no design margin; check actual transients and the application’s voltage requirement.
For a steady-state model, junction temperature follows a heat balance: generated power equals heat removed through the actual board and environment. A simple expression is TJ = TA + Ptotal Rtheta, provided that the chosen thermal resistance describes the reference points and mounting conditions of that model. Junction-to-solder-point resistance uses the cathode solder-point temperature; junction-to-ambient resistance uses ambient temperature. Those two references cannot be swapped without accounting for the intervening heat path.
Leakage generally changes with junction temperature. Consequently, a room-temperature leakage estimate inserted once into the thermal equation can underestimate the final power. Iterate an appropriate electrothermal model or measure the operating circuit across its required environment. The datasheet expressly notes that thermal runaway must be considered for Schottky diodes when reverse loss forms a significant part of total loss. It does not supply a universal leakage-doubling rate or a board-independent runaway threshold.
The package has pin 1 cathode and pin 2 anode. Its body is 1.2 × 0.8 × 0.6 mm, but production land dimensions must come from the manufacturer’s footprint drawing and the assembly process. Enlarging copper around the cathode can provide a heat path only if that copper remains on the cathode net. A thermal via does not become a ground via merely because it conducts heat.

Figure 2. Illustrative heat-flow and net-isolation concept. PMEG2010AEB Table 6 defines its solder-point path at the cathode tab. Connect any spreading copper and vias to the cathode net, which is ground only when the actual circuit makes it ground. This is not a manufacturing land pattern or measured thermal result. Source: manufacturer documents in References; calculation / diagram: YG GROUP.
The drawing illustrates connectivity, not a qualified footprint. It assigns no thermal resistance to a copper area or via count. Layer thickness, spreading geometry, neighboring heat sources, airflow and assembly quality influence the result. Copying a promised temperature reduction without those conditions would conceal the design variables that actually determine heat removal.
Table 2. Related diode package comparison | Source: manufacturer documents in References; assumptions and operating conditions are stated in the table or adjacent text. Compiled / calculated by: YG GROUP.
| Model | Verified scope | Selection boundary |
|---|---|---|
| PMEG2010AEB,115 | Primary 20 V Schottky in SOD523; values above from its datasheet | Current and thermal conditions must be retained |
| PMEG2010ER | Nexperia product page identifies a 20 V, 1 A Schottky in SOD123W | Requires a new footprint and its own leakage/thermal assessment |
The PMEG2010ER product page establishes a real nearby candidate. It does not establish identical forward loss, hot leakage or board temperature. A larger package can justify investigating heat-removal options, but its numerical suitability cannot be inferred from a matching 20 V / 1 A headline.
For validation, record forward and reverse voltage/current waveforms, ambient conditions and the cathode solder-point temperature. Compare calculated interval losses with the measured thermal behavior, allowing for probe loading and measurement uncertainty. Repeat at the highest intended ambient and reverse bias. If leakage rises materially as the board warms, include that feedback in the decision before approving the diode for the application’s continuous operating profile.